

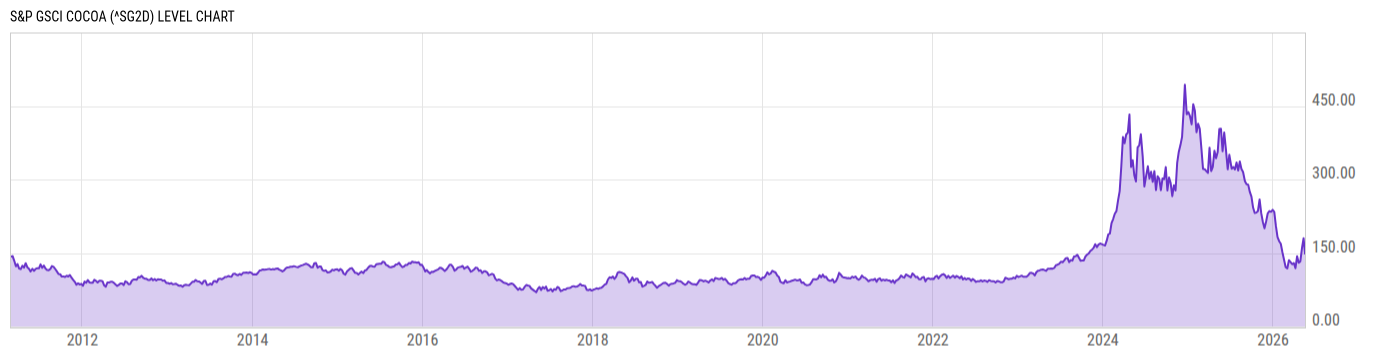
S&P GSCI Cocoa (^SG2D)
148.90
-8.29
(-5.27%)
USD |
May 18, 15:40
Level Chart
Key Stats
Basic Info
| N/A | |
| Core Index Name | S&P GSCI Cocoa |
| Return Type | Price Return |
| Currency Code | USD |
| Category Hedge Type | Not Hedged |
Index Varieties
| Return Types | |
| Excess Return | S&P GSCI Cocoa Excess Return |
| Total Return | S&P GSCI Cocoa Total Return |
Total Return Performance
As of May 15, 2026.
Returns for periods of 1 year and above are annualized.
Annual Performance
As of May 18, 2026.
Basic Info
| N/A | |
| Core Index Name | S&P GSCI Cocoa |
| Return Type | Price Return |
| Currency Code | USD |
| Category Hedge Type | Not Hedged |
Index Varieties
| Return Types | |
| Excess Return | S&P GSCI Cocoa Excess Return |
| Total Return | S&P GSCI Cocoa Total Return |